On-board Survey Processing
Introduction
Due to the small size of the transit market in the Triangle and the small household survey sample size, the household survey does not contain enough transit observations to estimate behavioral models for transit users. On-board surveys are critical to fill this gap. They are intercept surveys, which means they are conducted on the bus itself. They ask transit riders a series of questions in order to obtain detailed information about demographics, trip purpose, modes used, and other variables.
In the Triangle, a survey of 9,231 GoTriangle and DCHC area transit riders was conducted in 2014 (excluding Duke Transit). 5,390 CAMPO area transit riders were surveyed in 2015 along with new GoTriangle routes. These are used to gain insight into the transit market.
Combining surveys
Unlike the household surveys, the transit surveys were collected by different companies. Combining the surveys required translating different field codes into a combined set of values. The surveys collected the same basic information, which made this process easier. Additionally, because different routes were collected in each survey, no routes were double counted and no adjustments to the sample weights were needed.
Geocoding
As with the household survey, the transit trip latitude/longitude values were translated into TRMG2 TAZs. For a transit trip, this includes the home, origin (which could be somewhere other than home), destination, boarding, and alighting locations. A sample of this is shown in the table below:
| route | weight | home_taz | orig_taz | board_taz | alight_taz | dest_taz |
|---|---|---|---|---|---|---|
| Route 2: Falls of Neuse- INBOUND toward Downtown | 6.76 | 1448 | 2651 | 2542 | 1429 | 1935 |
| Route 1: Capital- OUTBOUND toward Triangle Town Center | 7.45 | 1781 | 1435 | 1429 | 1446 | 1448 |
| Route 2: Falls of Neuse- INBOUND toward Downtown | 6.76 | 1467 | 1700 | 1699 | 1429 | 1467 |
| C-Tran: Route 2: COUNTERCLOCKWISE | 2.83 | 1892 | 1892 | 1874 | 2209 | 2209 |
| C-Tran: Route 4: OUTBOUND toward NC Hwy 55 | 2.73 | 2339 | 2335 | 2269 | 2326 | 2339 |
| C-Tran: Route 5: INBOUND toward Train Station | 2.45 | 1646 | 2180 | 2180 | 2269 | 1646 |
Reasonableness checks
A high level review of the combined survey was performed to make sure field translations and survey combination had not introduced errors. Some of those checks are shown in the charts below. All dimensions checked looked reasonable.
Agency
The distribution by agency lines up fairly well with the size of the agencies themselves.

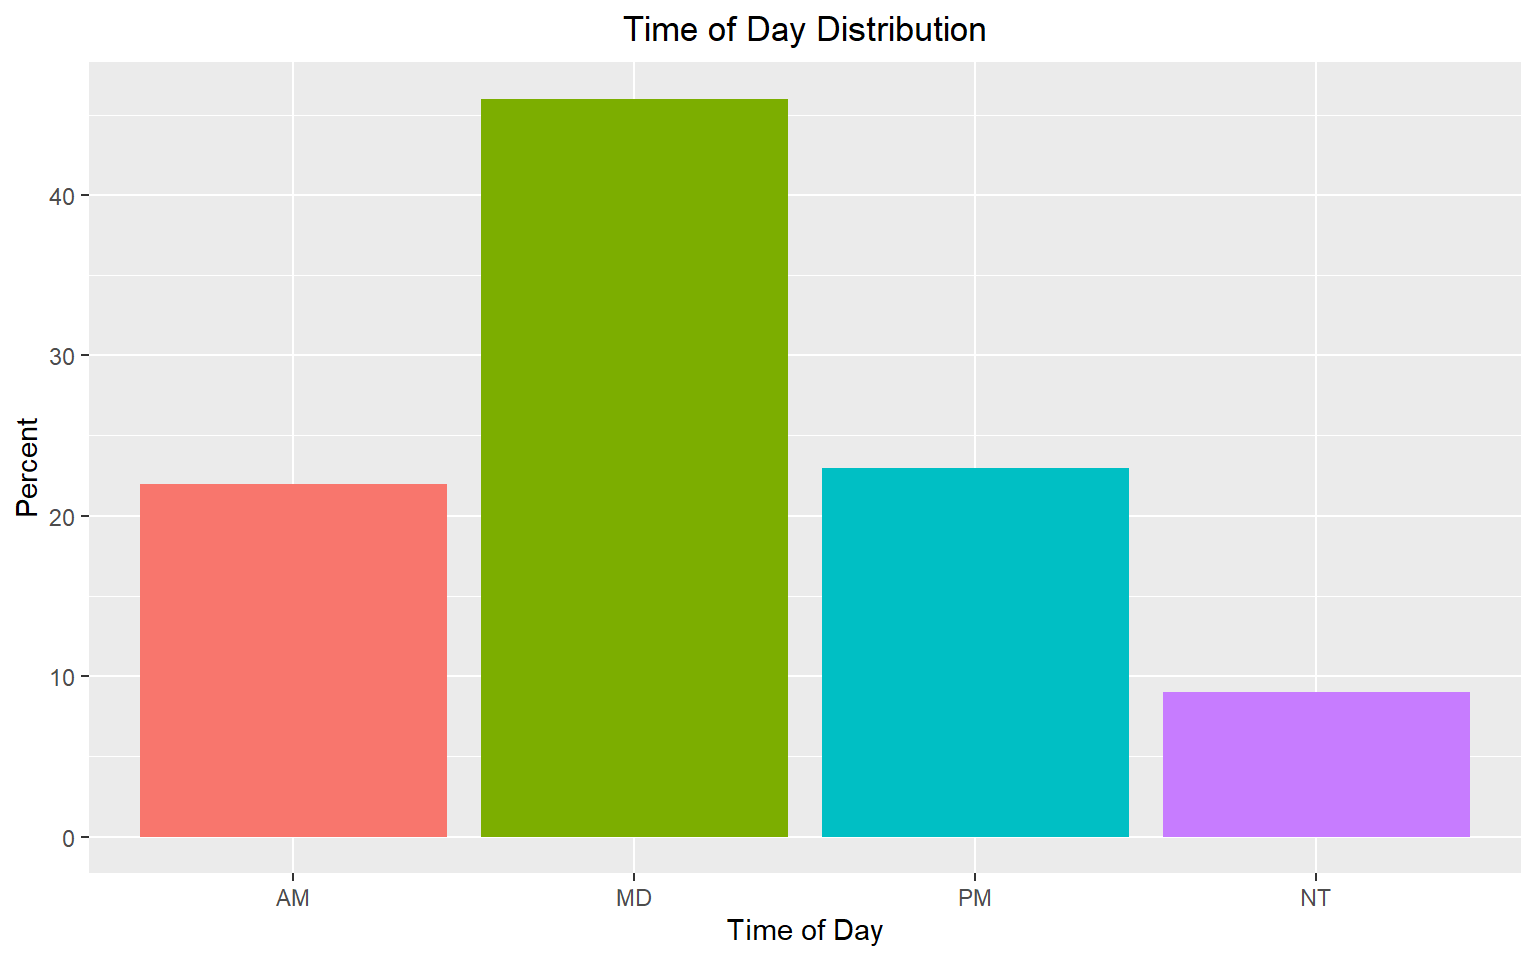
Time of Day
The time period definitions are the same as those defined in the time of day documentation. The AM period, for example, is only 2 hours. This explains the large number of transit observations categorized as midday.
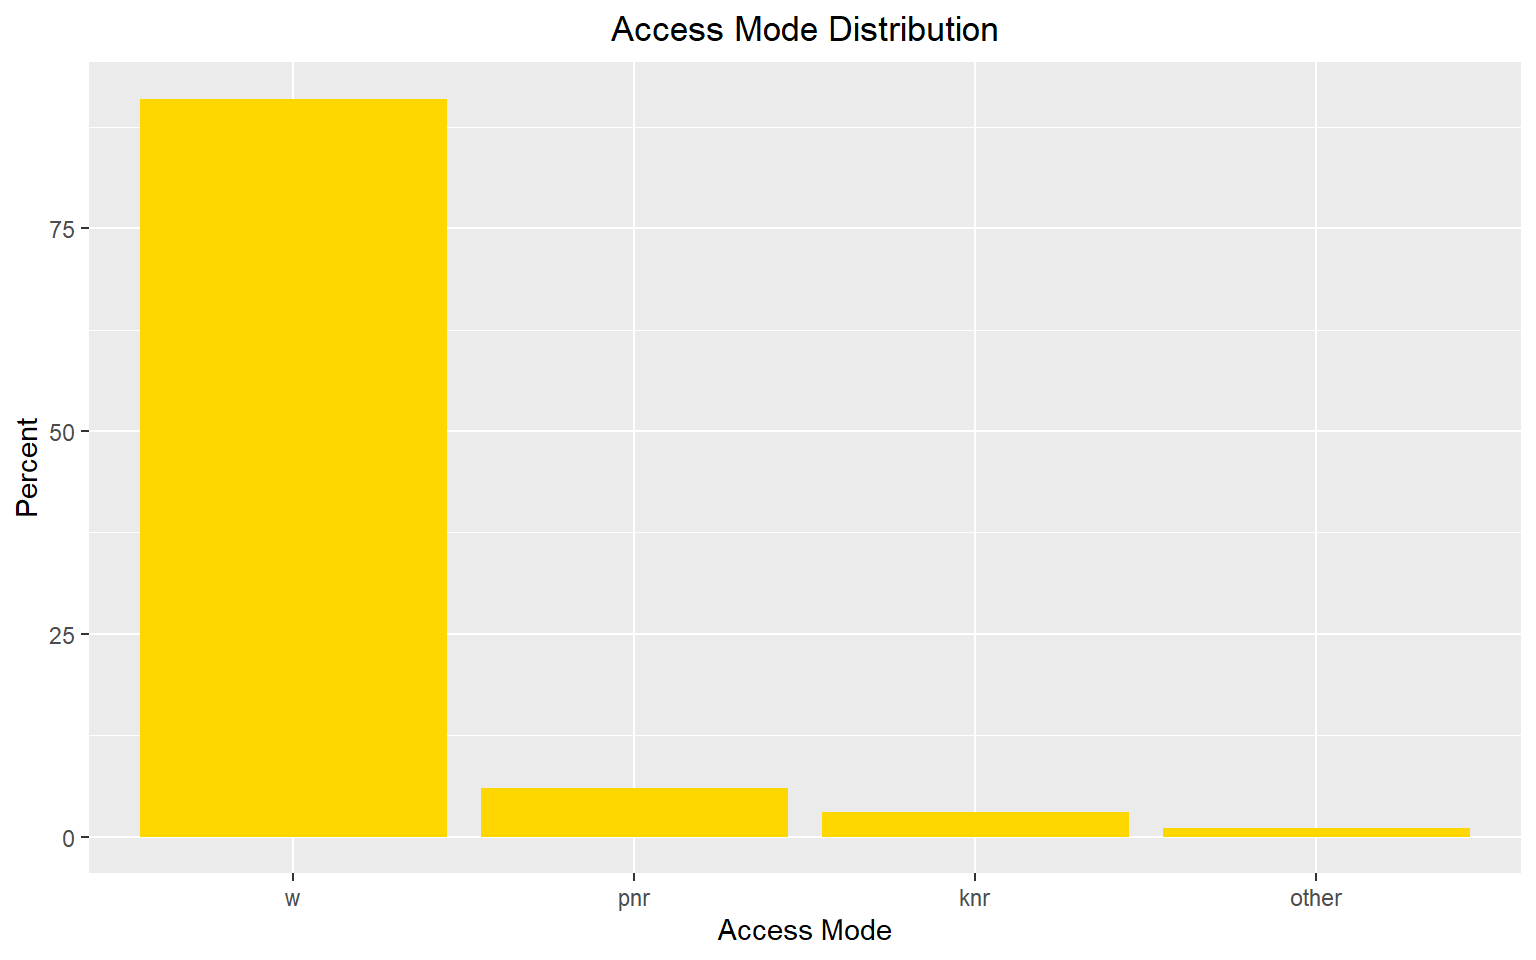
Access Mode
Walk access is the dominant mode in the survey, which matches transit behavior in the region.
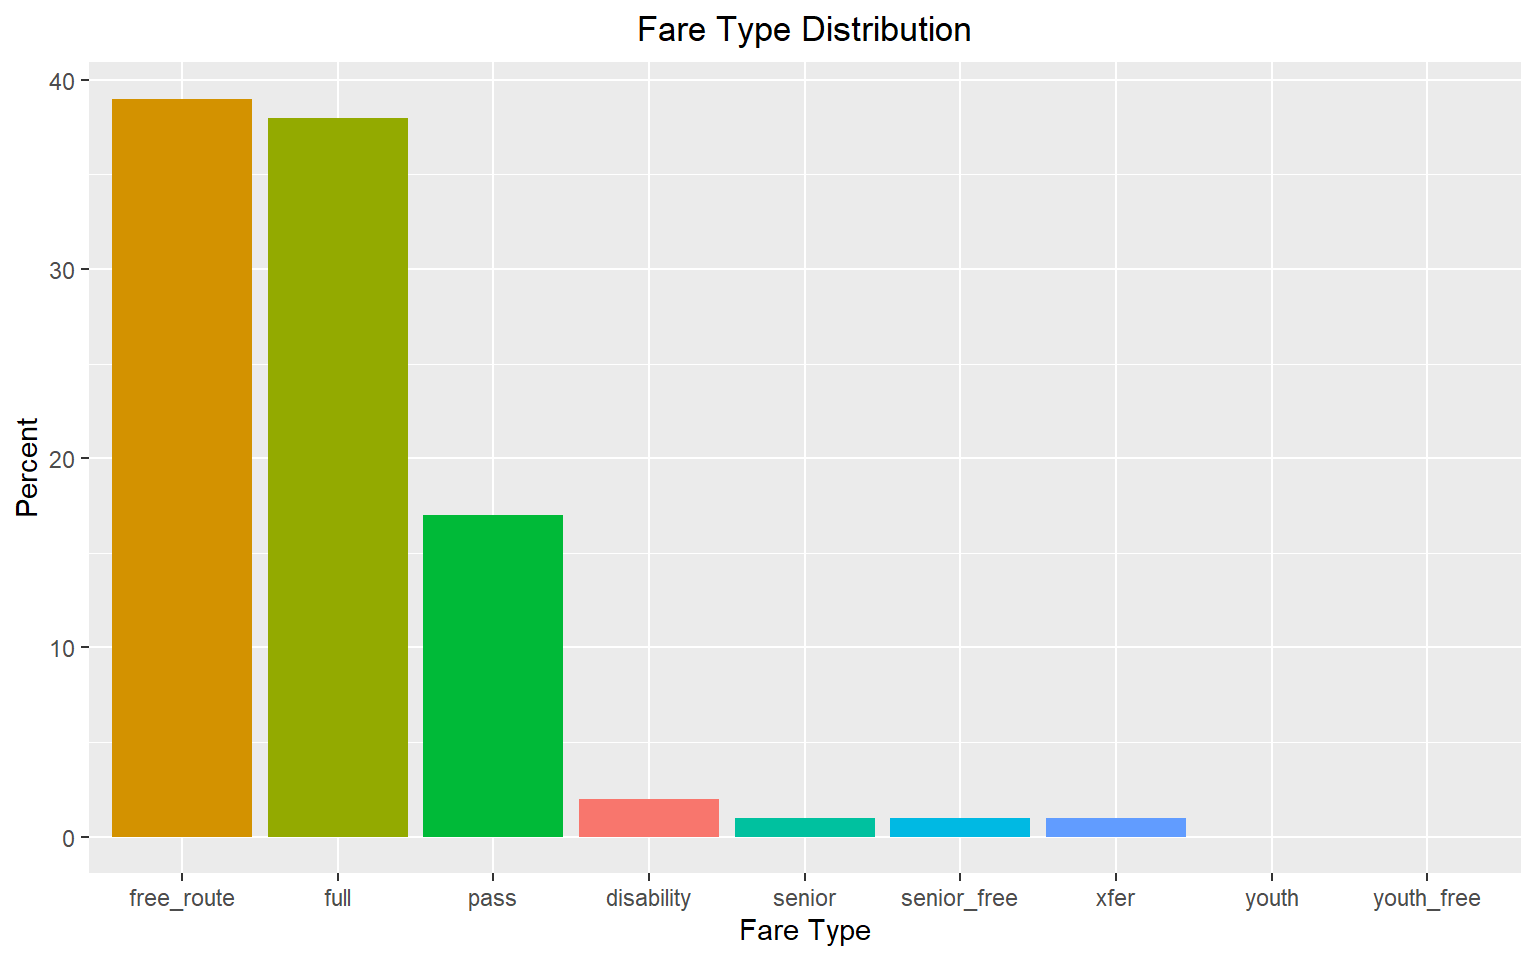
Fare Type
Free routes are the most common, which is a reflection of the CHT system which offers many routes with no fare.
Survey Assignment
Caliper assigned the combined transit survey to the 2016 transit route networks used by the model. Neither survey was collected in 2016, so route offerings are likely different. However, assigning the survey can help identify errors in the networks. These can include missing access links or route mis-coding, but also gives insights into things transfers. If the model is not penalizing transfers enough, this early assignment will show more transfers than in the survey.
The assignment process involved processing the survey into the appropriate matrices by time of day, transit mode, and accesss mode. The model’s assignment macros in TransCAD were used to assign the matrices to the route system, and the results were compared to reported ridership by route. One of the conclusions was in fact that transfers needed to be penalized heavier in the transit network settings. In the survey, no one transferred more than once.
The percent root mean square error (%RMSE) for route-level boardings was 96.8%. The agency-level %RMSE was 52.63%. The table below shows the agency-level comparison.
| Agency | Observed | Modelled | Difference | Absolute Difference | Percent Difference |
|---|---|---|---|---|---|
| CAT | 23,218 | 39,299 | 16,081 | 16,081 | 69.26 |
| CHT | 26,371 | 21,407 | -4,964 | 4,964 | -18.82 |
| CTRAN | 1,003 | 1,805 | 802 | 802 | 79.96 |
| DATA | 21,601 | 24,554 | 2,953 | 2,953 | 13.67 |
| NCSU | 16,699 | 18,255 | 1,556 | 1,556 | 9.32 |
| TT | 9,184 | 15,399 | 6,215 | 6,215 | 67.67 |
These differences are large, but manual path checking did not uncover any errors. This test assignment was performed on a network with a rough initial guess of travel times, which contributed to these differences. Further differences may be because the surveys were from 2014 and 2015 while the transit network is 2016. Any changes in route alignments or offerings would lead to higher discrepancies.
During model development, much more accurate roadway times were calculated from actual model assignments. Further, the transit network settings were also dialed in to achieve final results that look much more reasonable.
TransCAD GIS Software, 2022