Parking Model
Introduction
The parking model component of the TRMG2 determines where auto travelers will park and either walk or take transit to their ultimate destination. The model is only applied to CBD and university areas where parking is generally limited and requires payment.
In TRMG2, results of the parking model influence both mode choice and destination choice, which means travelers react realistically to changes in parking availability and price.
Design
The parking model is applied at the end of the demand model stream, just before traffic assignment. Trip matrices from the preceding demand models are combined across purposes maintaining segmentation between trips on work tours and non-work tours (SOV and HOV are also maintained for assignment classes, but the same models are applied to them).
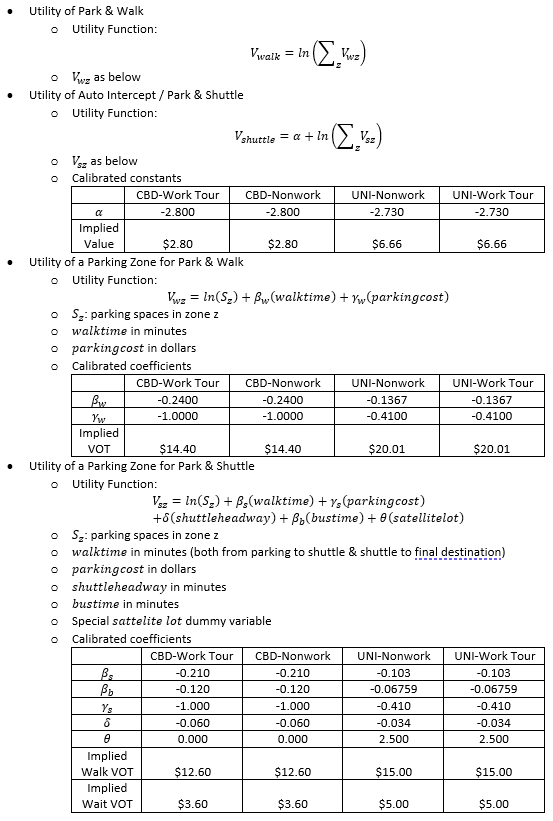
The TRMG2 parking model is adapted from the one estimated for the 2016 Triangle Region Parking Behavior Study conducted by RSG. It has been reformulated for application in the regional model. Several differences exist between the model estimated by RSG and the TRMG2 model. Cailper added the lowest level choices of parking zones. In addition, the TRMG2 model only includes “Park and Walk” and “Park and Transit” options. For “Park and Transit”, the G2 uses the actual transit network for path building. This ensures travelers see accurate options and make appropriate decisions.
The G2 design is a departure from the previous generation of the TRM, which included “Park and Walk” (called “Auto Intercept”) as a primary mode in the mode choice model. G2 effectively treats it as a subchoice under the auto mode. The structure and nesting coefficient in the 2016 RSG study imply that travelers view the auto intercept mode as a parking strategy and not a main mode choice.

The parking model in TRMG2 is a two-level, nested logit model that combines parking mode and destination choice. Various coefficient values and implied values of time differ from those in 2016 for a number of reasons. This includes Caliper’s scaling from Stated Preference to Revealed Preference, calibration of the model, and because the values of time reported in the 2016 report were generally scaled to transit fares rather than parking costs.
The model was calibrated to the 2016 survey in two steps. The model’s AM period was calibrated since the survey only asked about the first trip of the day to downtown / campus and was strongly skewed towards AM trips. First, the lower level, parking destination choice was calibrated by scaling the non-size terms to match the observed average walk time from the survey for the park-and-walk mode which was 7.8 minutes for CBD areas and 11.25 minutes for campus areas. The park-and-shuttle coefficients were scaled consistent with park and walk rather than calibrated separately. This was both in order to bias the mode choice and because the 2016 survey would have required significant additional processing to obtain the time from parking to destination for the park-and-shuttle mode. Second, the upper level parking mode choice was calibrated by adjusting the alternative specific bias constant for park and shuttle to match observed shares for the mode which were 6.9% for CBD areas and 14.6% for campus areas.
A parameter was also added to allow the model to better reflect satellite parking lots like the Friday Center at UNC. In the absence of actual parking counts at the Friday Center, the parameter was simply asserted to produce a reasonable amount of about 250 parked vehicles.
TransCAD GIS Software, 2022